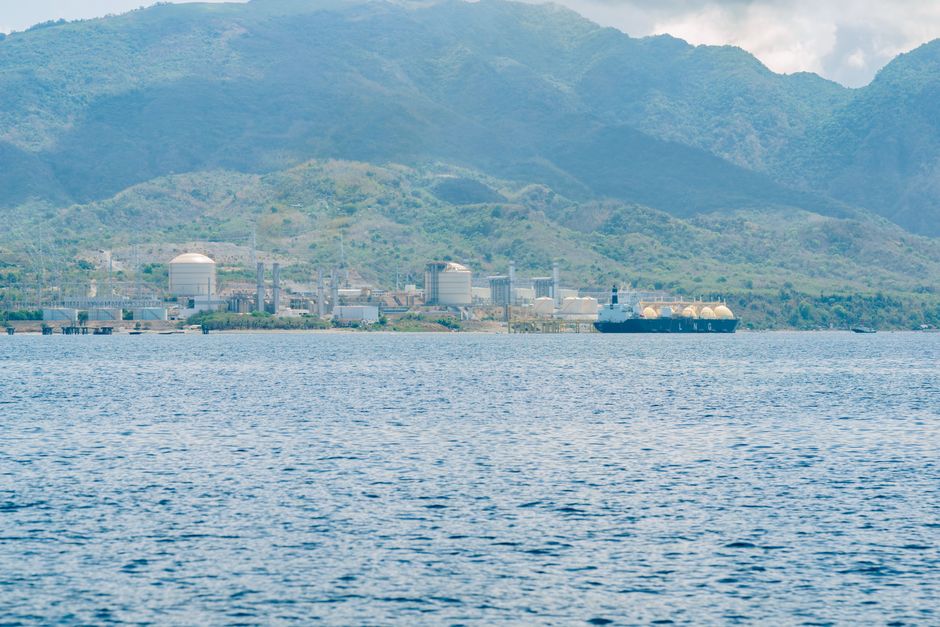
Transit through the Gulf of Hormuz was halted following an escalation of conflicts in the Middle East on February 28, 2026, bringing LNG exports from Qatar and the United Arab Emirates (UAE) to a standstill, according to reports. The Gulf of Hormuz serves as the only maritime exit for LNG exports from Qatar and the UAE, which together supply approximately one-fifth of the global LNG supply.
Between March and June, more than 300 LNG cargoes from Qatar and approximately 20 from the UAE failed to reach markets. Around 160 LNG vessels were stranded in the Gulf or forced to anchor and wait in the Oman Gulf, a disruption that narrowed spot market capacity due to the reduction in available vessels.
Security risks in the Red Sea and Suez Canal prompted LNG carriers to reroute around the Cape of Good Hope. This rerouting added 15 to 20 days to LNG shipments traveling between the Atlantic and Asia-Pacific regions.
Rising charter rates and marine fuel costs
The disruption in the Gulf of Hormuz led to the highest LNG vessel charter rates since the 2022 energy crisis. For triple-fuel diesel-electric (TFDE) LNG vessels, the daily spot charter rate reportedly rose from $5,000 at the start of February to $235,000 at the beginning of March. The monthly average daily charter rate for TFDE vessels was reported to have increased from $18,000 in February to $108,000 in March.
Steam turbine LNG vessels also saw significant increases, with the monthly average daily charter rate rising from $3,000 in February to $50,000 in March.
Increase in the average price of marine fuel used by LNG fleets in March
Marine fuel costs saw sharp rises, with the average price for LNG fleets increasing by 73% month-over-month in March to exceed $800 per ton. In June, the average price of marine fuel for LNG vessels was $680 per ton, which is 33% higher than the same month in the previous year and 8% above the five-year June average.
Insurance and transportation price hikes
Insurance costs for transiting the Gulf of Hormuz rose significantly. The additional war risk premium for LNG vessels increased from approximately 0.25% of vessel value to between 5% and 10%. For a single transit of a $250 million LNG vessel through the Gulf of Hormuz, war risk insurance costs reached up to $25 million. During the peak of the conflict, insurance premiums for LNG cargoes reached between 10% and 20% of cargo value.
The share of freight in the total LNG delivery price increased from 13% to approximately 25% due to rising transportation costs. For example, the cost of transporting LNG from the US Gulf Coast to Southwest Europe increased from $0.6 per MMBtu in Q2 2025 to $1.1 per MMBtu in Q2 2026. Transporting LNG from the US Gulf Coast to Northeast Asia via the Cape of Good Hope rose from $1.8 per MMBtu to $3.6 per MMBtu between the same periods.
Alternative routes also saw cost shifts. The cost of transporting LNG from the US Gulf Coast to Northeast Asia via the Panama Canal rose from $1.6 per MMBtu in July 2025 to approximately $5 per MMBtu in March 2026. The average transportation cost via the Panama Canal for LNG shipments in Q2 2026 was $2.8 per MMBtu.
Canal usage and future capacity
The number of LNG vessels using major canals has decreased. Use of the Suez Canal dropped from 509 vessels in 2021 to 140 in 2025, while Panama Canal usage fell from 251 vessels in 2021 to 32 in 2025.
Some LNG vessels operating under long-term contracts with Qatar became available in the spot market due to reduced exports, which partially alleviated capacity constraints from April onward.
Looking ahead, the Global Energy Forum (GECF) expects approximately 250 million tons per year of new LNG liquefaction capacity to come online globally by 2030. Approximately half of this projected new capacity is expected to be concentrated along the US Gulf Coast. Additionally, new terminals on the Pacific coasts of Canada and Mexico are expected to enable direct shipments to Asian markets, and new projects in Africa are expected to create alternative supply routes for Europe and Asia.